19

I've looked at some of the statistics for SFSE contributions for this year (based on whatever normal members can see) and it looks like it has been an amazing year for our community as a whole. Can the moderators publish some stats at the end of this month in terms of

  • Count of New members added through the year (YoY growth)
  • Ratio of questions answered/ posted
  • Top Questions & answers for the year
  • Number of badges given out through the year
  • Overall edits, flags count for the year

P.S. - It's a good time to reflect on the year gone by. For those interested in reading, I took some time to reflect on my year 2015 as a member of the Salesforce developer community

3

2 Answers 2

16

I decided to dig into the database a bit to get a few more stats as requested and because I was also curious.

New Users By Year:

+------+-----------+
| Year | New Users |
+------+-----------+
| 2015 |      8357 |
| 2014 |      5359 |
| 2013 |      2260 |
| 2012 |       943 |
+------+-----------+

New Users in 2015 By Month

+---------+-----------+
|  Month  | New Users |
+---------+-----------+
| 2015-12 |       660 |
| 2015-11 |       734 |
| 2015-10 |       873 |
| 2015-09 |       764 |
| 2015-08 |       733 |
| 2015-07 |       797 |
| 2015-06 |       784 |
| 2015-05 |       620 |
| 2015-04 |       586 |
| 2015-03 |       702 |
| 2015-02 |       570 |
| 2015-01 |       534 |
+---------+-----------+

Question/Answer Stats:

For 2015, there have been 16,050 questions asked that haven't been deleted. Of these, 11,996 have at least one answer.

Top 10 Questions Asked in 2015 by Score

Top 10 Answers Posted in 2015 By Score

Top Badges Awarded in 2015*

+------------------+-------------------------+
|      Badge       | Number Of Times Awarded |
+------------------+-------------------------+
| Student          |                    2683 |
| Informed         |                    1596 |
| Editor           |                    1566 |
| Scholar          |                    1539 |
| Autobiographer   |                    1493 |
| Supporter        |                    1247 |
| Popular Question |                    1167 |
| Teacher          |                    1115 |
| Tumbleweed       |                     955 |
| Notable Question |                     617 |
| Commentator      |                     604 |
| Yearling         |                     593 |
| Custodian        |                     373 |
| Curious          |                     336 |
| Critic           |                     239 |
| Nice Question    |                     183 |
| Revival          |                     157 |
| Citizen Patrol   |                     139 |
| Nice Answer      |                     124 |
+------------------+-------------------------+

* This only includes badges awarded more than 100 times.

Edit Stats

There were a total of 17,349 edits performed this year. I limited the total to the title and body edits, leaving out trivial tag edits.

Flag Stats for the Year

+-------------+-----------+------------------------+---------------+
| Total Flags | Mod Flags | Spam & Offensive Flags | Comment Flags |
+-------------+-----------+------------------------+---------------+
|        2813 |      2484 |                    210 |           119 |
+-------------+-----------+------------------------+---------------+

Mod Flags include Not An Answer, Other, and Low Quality flags.

3
  • 1
    Those are pretty awesome stats. Thanks for sharing!! Commented Dec 28, 2015 at 18:44
  • 2
    @NormalHuman I'm putting it to Meta.SE to offer suggestions about what sites would want for annual stats. Good idea.
    – Taryn StaffMod
    Commented Dec 28, 2015 at 20:58
  • Hoping this triggers the change for for all sites to transition from the retired evaluations to these queries. Thank you once again! Commented Dec 30, 2015 at 4:19
8

There is the Site Analytics privilege at 25,000 rep. Those with access can see it at https://salesforce.stackexchange.com/site-analytics.

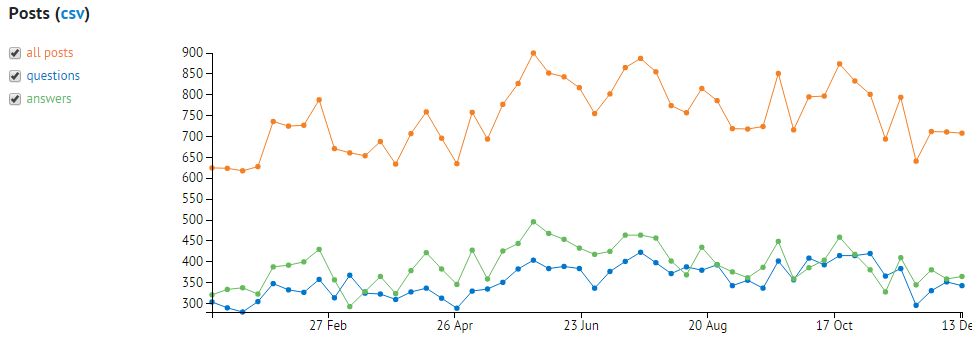
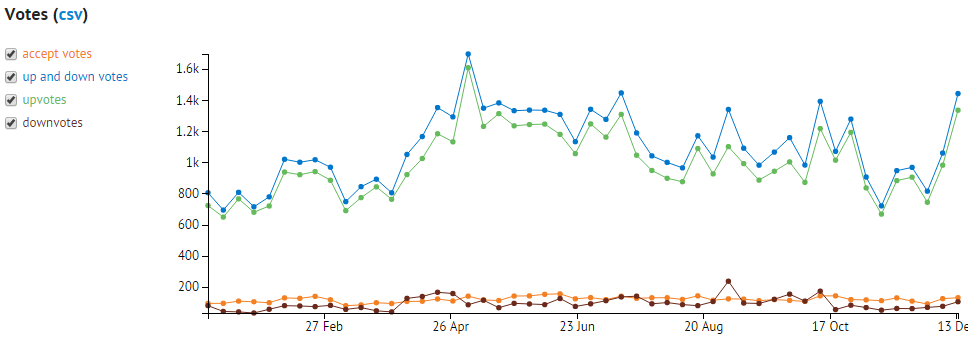
Here are the weekly stats for the year to date for two of the available areas.

Posts

enter image description here

Votes

enter image description here


There is also the StackExchange Data Explorer. With that you could probably find the exact answers you are looking for.

I came across the existing Yearly stats query that has some further interesting stats.

year questions answers 
---- --------- ------- 
2012 1559      2863    
2013 5823      8227    
2014 12004     15095   
2015 16131     17805   
2016 352       393    

year accepts upvotes downvotes 
---- ------- ------- --------- 
2012 1033    11099   443       
2013 2888    37833   1508      
2014 5360    55480   3323      
2015 6264    51715   4942      
2016 155     1509    98   

year comments 
---- -------- 
2012 6174     
2013 20136    
2014 37318    
2015 46732    
2016 1280  

year Edits 
---- ----- 
2012 1933  
2013 6365  
2014 12217 
2015 14467 
2016 475  

year total_questions total_answers 
---- --------------- ------------- 
2012 1637            3113          
2013 6280            9012          
2014 13918           16800         
2015 18285           20149         
2016 367             447  
2
  • Daniel - thank you for sharing the stats. The Data Explorer and the charts are handy and provide a good overview for what I was looking for. As for the Site Analytics privileges (25K points), I'm not there yet but I'll definitely make sure I get there soon enough so I can look at the next year 2016 stats! Cheers! Commented Dec 27, 2015 at 14:01
  • Awesome, thank you! Commented Jan 13, 2016 at 8:08

You must log in to answer this question.

Not the answer you're looking for? Browse other questions tagged .